

By Heinz P. Bloch, [email protected]
Process pump user-operators often want simple rules-of-thumb to determine maximum allowable vibration. Of course, rules-of-thumb should not be confused with statistical proof. Many times, general experience and common sense are of greater value than statistics. Essentially, this article deals with a few experience-based observations on the issue of condition monitoring for process pumps (Ref. 1).
Vibration and its effect on bearing life
Pumps, like all rotating machines, vibrate to some extent due to response from excitation forces, such as residual rotor unbalance, turbulent liquid flow, pressure pulsations, cavitation, and pump wear. The magnitude of vibration will also be amplified as flows deviate from best-efficiency (Figure 1) and as the vibration frequency approaches the resonant frequency of a major pump, foundation and/or connected piping.
Vibration from the running pump is very often transmitted to the non-running (standby) pump. This transmitted vibration tends to wipe off the oil film on the bearings of non-running pumps, causing metal-to-metal contact. Bearing degradation then shows up when the standby pump is put in service. Degradation is often reduced by switching or alternating from the “A” pump to the “B” pump on a 4 to 6-week basis.
A number of published observations on pump vibration and its effect on bearing life lead to a plot (Figure 2) which probably brackets 90{87a03eb4327cd2ba79570dbcca4066c6d479b8f7279bafdb318e7183d82771cf} of all process pumps.
No two predictions are the same; yet, Figures 2 and 3 illustrate the same point: Vibration excursions tell a story and reflect the condition of a process pump. The root cause may be hydraulic and temporary; it could relate to flow disturbances that vary with flow rate. Or, the root cause could be related to deficiencies in one or more mechanical components. Component imbalance or bearing defects may be causing vibration. Either way, vibration reduces bearing life in accordance with Figure 2.
The absolute value of vibration is not necessarily as important as the suddenness of a vibration increase. As an example, if pump vibration had been around 0.1 ips (2.5 mm/s) for the past two years and had increased to 0.3 ips (7.5 mm/s) in a single day, we could consider this a more serious event than vibration that started at 0.3 ips and then gradually increased to 0.4 ips (10 mm/s) in the span of 12 months.
Figure 3 relates (conservatively) how an increase in overall vibration due to bearing-internal deterioration will shorten bearing life and by what percentage. It can be reasoned that vibratory activity adds to the normal bearing load. Bearing manufacturers report that rolling element bearing life varies exponentially with load. For a typical ball bearing, the exponent is 3; therefore, a two-fold load reduces bearing life by a factor of 2^3 = 8. The bearing life is then only 12{87a03eb4327cd2ba79570dbcca4066c6d479b8f7279bafdb318e7183d82771cf} of what it would have been at normal load conditions. A compelling case is thus made for keeping vibration low.
For most pump reliability improvement professionals the issues of interest are not whether or not the pump vibrates but:
• If the amplitude and/or frequency of the vibration is sufficient to cause actual or perceived damage to any of the pump components
• If the vibration is a symptom of some other damaging phenomenon happening within the pump
• If the relationship between vibration severity and bearing life can be quantified with a reasonable degree of accuracy
Various industry organizations, such as HI (the Hydraulic Institute, in ANSI/HI 9.6.4, Ref. 3), and API (the American Petroleum Institute in its Standard API-610) have set pump vibration limits for general guidance. All are reaching back to the experience of individual reliability professionals and multinational pump user companies that had implemented daily machinery condition reviews (monitoring and surveillance) decades ago.
Some of these professionals had assisted operating personnel by listing acceptable, reportable, and mandatory shut-down levels of vibration. These levels represent experience-based values that rely on the bearing life vs. vibration approximations for general-purpose machinery. They have been widely published since the late 1940s as allowable vibration velocities.
Traditionally, 0.35 ips (~ 9 mm/s) was given as a maximum allowable vibration velocity for “total all pass” (overall) readings taken on bearing caps or housings. However, machinery vibration and its measurement are complex matters and may require some clarification. Typical considerations might include:
1. Vibration can be measured and/or analyzed by using units of displacement, velocity or acceleration severity to evaluate the health of the machine. As stated earlier, the primary or traditional measure of vibration used by industry today is velocity. Because most pump users use this parameter, comparisons are made easier.
2. Either the “total all-pass” or the “filtered” frequency can be used. Most industry specifications and standards use “total all-pass” vibration values to identify problem pumps. Filtered values are reserved for determining where the vibration originates. This latter determination is generally called “vibration analysis.”
3. RMS (root mean square) as well as peak-to-peak values are sometimes measured or specified. The Hydraulic Institute (HI) has chosen RMS (root-mean-square) acceptance limit values. HI recognizes that most vibration instruments actually measure vibration in RMS terms and then calculate peak-to-peak values, if required. API, on the other hand, generally refers to peak-to-peak readings. RMS values are roughly 0.7 multiplied by peak measured values. However, this relationship applies only to vibration consisting of a single sinusoidal waveform. For more complex waveforms, this conversion does not yield correct results.
4. The acceptable vibration amplitude (as-new vs. post-repair levels) may have to be specified for a particular application. Acceptance limits will change along with overall pump power and flow rate regions. The Hydraulic Institute and ISO base acceptable vibration limits on pump type and power level, while API gives different limits for the “preferred” and “allowable” operating regions. (See vibration acceptance limits, below, for “as-new” acceptance values).
5. It is difficult to pre-define how factory test stand vibration measurements should compare with field (at site) values. The exact effects of foundation stiffness/grouting are difficult to predict. Generally, the stiffness of a field pump foundation is much higher than the stiffness found on a factory test stand, especially if the pump base plate is grouted. That is why the Hydraulic Institute vibration standard allows higher test stand values (up to twice field values). For vertical turbine pump installations, it is especially important to know the actual foundation stiffness to avoid high vibration from operation at a structural resonance frequency.
6. Cataloging how much the vibration amplitude and/or frequency has changed over the life of the machine is important. This is called “trending.” It is especially helpful to have an as-new vibration signature taken and kept on file for future comparison.
7. Location of vibration measurements: On a typical horizontal process pump, vibration readings are taken in the x, y, and z (axial) directions. Horizontal and vertical dry pit pump vibration measurements are normally taken on or near the outer, or uppermost, bearing) in the horizontal, vertical and axial planes, with the maximum value used for acceptance. Vertical turbine pump vibration measurements are taken at the top or bottom of the motor. Probes should not be located on flexible panels, walls, or motor end covers.
Monitoring methods differ
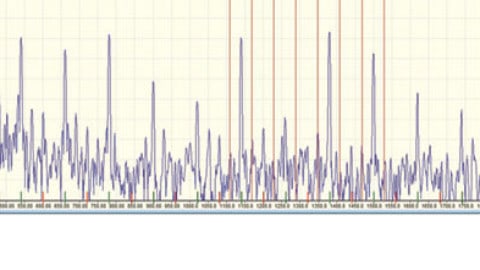
Some data gathering methods employ shock pulse monitoring (SPM) and, like all of the other methods, may or may not forward the results by wireless means. In simple terms, the SPM method detects the development of a mechanical shock wave caused by the impact of two masses. At the exact instant of impact, molecular contact occurs and a compression (shock) wave develops in each mass. The SPM method is based on the events occurring in the mass during the extremely short time period after the first particles of the colliding bodies come in contact. This time period is so short that no detectable deformation of the material has yet occurred. The molecular contact produces vastly increased particle acceleration at the impact point. The severity of these impacts can be plotted, trended and displayed.
There is also temperature monitoring. Suppose a pump bearing housing operates at 170F (~77C). Most people can place an index finger on such a bearing housing for about 5 seconds before the pain becomes too intense. However, 170F (~77C) is not excessive for process pumps. Proper pump surveillance calls for measurements with either a surface pyrometer or a hand-held non-contacting infrared heat sensing instrument (thermal gun).
Under no circumstances should the bearing housing be doused with water. Such cooling would probably cause the bearing outer rings to be cooled. Because metal shrinks upon being cooled, the already small bearing-internal clearances would be reduced to the point of being excessively preloaded. Bearing life would be curtailed by the very method thought to extend it.
Vibration acceptance limits
Hydraulic Institute Standard ANSI/HI 9.6.4 presents the generally accepted allowable pump “field” vibration values for various pump types (see Table 1). The standard is based on RMS total, or all-pass vibration values. The standard states that factory or laboratory values can be as much as twice these field limits, depending on the rigidity of the test stand. The ANSI/ASME B73 standard accepts two times the HI 9.6.4 values for factory tests performed on chemical end suction pumps (Ref. 3). HI includes the API-610 values for end suction refinery pumps (in RMS terms); the API-610 document requires that these acceptance values be demonstrated on the factory test stand.
The HI Standard also states that stipulated values only apply to pumps operating under good field conditions. Good field conditions are defined as:
1. Adequate NPSH margin
2. Operation within the pump’s preferred operating region—typically 70{87a03eb4327cd2ba79570dbcca4066c6d479b8f7279bafdb318e7183d82771cf} and 120{87a03eb4327cd2ba79570dbcca4066c6d479b8f7279bafdb318e7183d82771cf} of BEP (Table 3 only lists the constant values required for low and high pump power ratings. The acceptable vibration, between the low and high power values, varies linearly with power on a semi-log graph).
3. Proper pump/driver shaft (coupling) alignment.
4. Pump intake must conform to ANSI/HI 9.8 (“Pump Intake Design”).
It should also be noted that the acceptable vibration values for slurry and vertical turbine pumps are about double the values given for horizontal clean liquid pumps.
Once a pump is accepted and commissioned, somewhat higher total (all-pass) vibration values are usually accepted before further follow-up and analysis are deemed appropriate. As a general rule, repair follow-up is recommended if vibration levels increase to twice the “field” acceptance limits (or initial actual readings).
Causes of excessive vibration
Once a pump has been determined to have a high “total or all-pass” vibration level, the next step is to identify the cause. This would be the time to obtain a filtered vibration analysis and to look for predominance of one of many frequencies in the spectrum. Table 2 illustrates several predominant frequencies, although it is providing a narrow overview, at best.
Along those lines, the first step in the analysis should be to capture, and then evaluate, the multiples of pump running speed (Table 2). A graphic display would often be called a “filtered” velocity plot, or frequency spectrum. Actual analysis can point to several possible causes, among them:
1. Rotor unbalance (new residual impeller/rotor unbalance or unbalance caused by impeller metal removal – wear).
2. Shaft (coupling) misalignment
3. Liquid turbulence due to operation too far away from the pump best efficiency flow rate
4. Cavitation due to insufficient NPSH margin.
5. Pressure pulsations from impeller vane–casing tongue (cutwater) interaction in high discharge energy pumps.
Other possible causes of vibration may be more complex to analyze. Among these are:
Operating speed close to mechanical or hydraulic resonant frequencies of a major pump, foundation or pipe component. This is of special importance with large multistage horizontal and long vertical pumps. A margin of safety should be provided between rotor and/or structural natural frequencies and operating speed. Typical margins are 15 – 25{87a03eb4327cd2ba79570dbcca4066c6d479b8f7279bafdb318e7183d82771cf}. Vibration amplification will generally be greater than 2.5-times at a resonant frequency.
Vibration/resonance events to be evaluated on pumps include rotor lateral vibration and structural lateral vibration—rather common with long-shafted vertical pumps.
Poor pump suction or discharge piping can also cause increased vibration, normally by either increased cavitation or turbulent flow in the pump. Pump operating speed or vane pass frequencies could excite a piping structural or hydraulic resonance.
Bearing wear will usually show up in the vibration spectrum. Rolling element bearings have distinct vibration signatures based on the number of bearing balls or rollers. Recall, however, that monitoring deterioration of plastic bearing cages would require highly sophisticated monitoring techniques. This is one of the reasons why plastic cages can be used in pump bearings only after all relevant factors are taken into account.
Opening up of impeller wear ring clearances is primarily shown in performance measurements (Ref. 1). This wear can reduce the NPSHr margin and shift the pump operating flow point.
Broken rotor bars in electric motors will generate specific frequencies.
Rotor balancing
All impellers, irrespective of their operational speed, should be dynamically balanced (“spin-balanced”) before installation, either single or two plane. Two-plane balance is required for a wide impeller, typically when the impeller width is greater than 17{87a03eb4327cd2ba79570dbcca4066c6d479b8f7279bafdb318e7183d82771cf} of the impeller diameter. ISO balance criteria are usually invoked and an experienced balance shop will know them well.
Dynamic balancing of the three major rotating pump components, shaft, impeller and coupling, will increase mechanical seal and bearing life. All couplings in the weight or size ranges found in a modern refinery should be balanced, if they are part of a conscientious and reliability-focused pump failure reduction program.
Of course, if a facility is willing to remain repair-focused, it can continue to just plod along with “business as usual.” Still, reliability-focused plants agree: large couplings that cannot be balanced have no place in the majority of their process pumps.
The preferred procedure for process pumps in reliability-focused installations is to balance the impeller and coupling independently, and to then balance the impeller and coupling on the shaft as a single unit. Another method is to balance the entire pump rotor as an assembled unit and to do so one time only. That might be a bit problematic at locations that will subsequently go through repair cycles while trying to omit full rotor balance. Often, more problems are caused in successively disassembling and reassembling than would be caused by diligently balancing each individual component. For multistage pump rotors (both horizontal and vertical), individual component balance is generally preferred.
The static (single plane) balance force is always the more important of the two forces, static and dynamic (“couple force”). If balancing of individual rotor components is chosen, it is best to use a tighter tolerance for the static (single plane) force. In theory, if all the static force is removed from each part, there should be very little dynamic (couple) force remaining in the rotor itself.
For impellers operating at 1,800 rpm or less, the ISO 1940 G6.3 tolerance is acceptable. For 3,600 to 1,800 rpm, the ISO G2.5 rule is better. Both are displayed on balance tolerance nomograms for small and large machinery rotors. Generally, tighter balance tolerances (G1.0) are not warranted unless the balancing facility has modern, automated balancing equipment that will achieve these results without adding much time and effort.
Using older balancing equipment may make it difficult and unnecessarily costly to obtain and duplicate the G1.0 quality. Also, factory vibration tests have, at best, shown insignificant reductions in pump vibration with this tighter balance grade.
That, however, is not the point. Instead, let’s realize that relatively tight balance tolerances or good grades of balance are obtained on automated balancing machines just as quickly as would more liberal, less precise, balance specifications. Using an analogy, why allow bottles of medicine to contain between 99 and 101 tablets when modern filling machinery can guarantee to deliver precisely 100 tablets per bottle? Surely, a serious and reliability-focused user-consumer will insist on products with consistently high quality.
Balancing machine sensitivity must be adequate for the part to be balanced. This means that the machine should be capable of measuring unbalance levels to one-tenth of the maximum residual unbalance allowed by the balance quality grade selected for the component being balanced.
Rotating assembly balance is recommended whenever practical and if the tighter quality grades, G2.5 or G1.0, are desired. Special care must be taken to ensure that keys and keyways in balancing arbors are dimensionally identical to those in the assembled rotor. Impellers must have an interference fit with the shaft when G1.0 balance is desired. Although looseness between impeller hub and shaft (or balance machine arbor) is allowed for the lesser balance grades, it should not exceed the values given in Table 3 for grades G2.5 or G6.3:
What we have learned
• Initial guidance on allowable pump vibration is clearly available from the hundreds of articles and dozens of books that have been published in the decades since 1960. Up-to date summaries are contained in Ref. 2 and other modern texts.
• Since elevated vibration increases the forces acting on bearings, and since bearing life is related to bearing load, higher vibration will reduce bearing life. The rules of thumb and empirical relationships express these guidelines with sufficient accuracy for general purpose equipment.
• Modern data collectors and condition analyzers are available from a number of competent vendor-manufacturers. Also, many models are operating with wireless connections, while others are hand-held or hard-wired (Ref. 4). Each has its advantages and these must be considered on a case-by-case basis.
• Since rotor unbalance will lead to increased vibration, good rotor balance is essential. The issue of balance grade is moot in the very many instances where modern, often fully automated balancing machines are readily available. These balancing machines will achieve excellent equipment rotor balance as quickly and effectively as not-so-excellent balance.
• Bearing life is related to shaft misalignment and force transmission across couplings. These affect vibration severity (Ref. 5). While rules of thumb are not absolutes, their judicious application makes far more sense than rather simplistic requests to “prove it to me.”
The issue is about risk and the mitigation of risk. A fitting analogy deals with automobiles, where reasonable people know that driving on worn tires will put the passengers at greater risk than driving on new tires.
Likewise, the issues of vibration and shaft misalignment are intuitively evident to most of us. We should be quite satisfied with rules of thumb and empirical data where they appeal to common sense. They certainly do in this instance.
Don’t compromise safety and reliability. Read and apply “Pump Wisdom” (Ref. 6) and keep process pump vibration low. ■
References:
1. Beebe, R.S.; ”Machine Condition Monitoring,” MCM Consultants, Monash University, Gippsland, Australia, Engineering Handbook (2001 Edition)
2. Bloch, Heinz P. and Alan Budris; “Pump User’s Handbook” (2010) 3rd Edition, Fairmont Press, Lilburn, GA 30047 (ISBN 0-88173-627-9)
3. ANSI/HI Standard 9.6.4; (2001) Hydraulic Institute, Parsippany, NJ
4. Bloch, Heinz; Paul Lahr; Donald Hyatt; “Development of an Advanced Electronically Optimized Variable High-Speed Centrifugal Pump”, Proceedings of Pump Congress, Karlsruhe, Germany, October 4-6, 1988
5. Berry, Douglas L.; “Vibration vs. Bearing Life Increase”, Reliability, December 1995
6. Bloch, Heinz P., (2011) “Pump Wisdom: Problem Solving for Operators and Specialists”, John Wiley & Sons, Hoboken, New Jersey, ISBN 978-1-118-04123-9

Figure 1: Prominent pump standards recognize pump vibration magnitude is not uniform over the entire flow range (Source: API-610, 8th Edition, 1996)

Figure 2: How pump vibration affects bearing life (Ref. 2)

Figure 3: Bearing degradation shows up as vibration and can be related to life reduction
| PUMP TYPE | LESS THAN POWER (HP) | VIBRATION RMS, IN/SEC |
GREATER THAN POWER (HP) | VIBRATION RMS, IN/SEC |
| End Suction ANSIB73 | 20 | .125 | 100 | .18 |
| Vertical Inline, Separately-Coupled, per ANSI B73.2 | 20 | .125 | 100 | .18 |
| End Suction & Vertical Inline Close- Coupled | 20 | .14 | 100 | .21 |
| End Suction, Frame- Mounted | 20 | .14 | 100 | .21 |
| End Suction, API-610, Preferred Operation Region (POR) | All | .12 | All | .12 |
| End Suction, API-610, Allowable Operation Region (AOR) | All | .16 | All | .16 |
| End Suction, Paper Stock | 10 | .14 | 200 | .21 |
| End Suct. Solids Handling – Horizontal | 10 | .22 | 400 | .31 |
| End Suct. Solids Handling – Vertical | 10 | .26 | 400 | .34 |
| End Suct. Hard Metal/Rubber-Lined, Horizontal & Vertical | 10 | .30 | 100 | .40 |
| Between Bearings, Single & Multistage | 20 | .12 | 200 | .22 |
| Vertical Turbine Pump (VTP) | 100 | .24 | 1000 | .28 |
| VTP, Mixed Flow, Propeller, Short Set | 100 | .2 | 3000 | .28 |
Table 1: Allowable field-installed vibration values for pumps (Ref. 3)
| FREQUENCY | SOURCE |
| 0.1 x Running Speed | Diffuser Stall |
| 0.8 x Running Speed | Impeller Stall (Recirculation) |
| 1 x Running Speed | Unbalance or Bent Shaft |
| 2 x Running Speed | Misalignment |
| Number of Vanes x Running Speed | Vane/Volute Gap and Cavitation |
Table 2: Sources of Specific Vibration Excitations
| IMPELLER HUB BORE | MAXIMUM DIAMETRAL LOOSENESS | |
| < 1,800 rpm | 1,800-3,600 rpm | |
| 0 – 1.499 in. | . 0015 in. | . 0015 in. |
| 1.5 – 1.999 in. | . 0020 in. | . 0015 in. |
| 2.0 in. and larger | . 0025 in. | . 0015 in. |
Table 3: Maximum Diametral Hub Looseness


