


 by Ray Hardee, Chief Engineer, Engineered Software
Piping systems are often called upon to deliver product or services that differ from their original design intent. The engineer is then tasked to make the required changes with minimum impact to production or service delivery with the smallest possible capital outlay. Sometimes what might seem to be a simple, straightforward solution has unintended consequences due to the interaction between all the pump, process, and control elements. Using system analysis software, an engineer can explore these interdependencies and determine the best course of action.

Figure 1: Continuous filtering unit.
The piping system shown in Figure 1 is a simplified continuous filtering process unit consisting of a constant speed pump element (filter unit pump) which provides energy into the fluid, control elements (process control and recirculation valve) that maintain the quality of the product, and the process elements (tanks, pipe, and filter rack) which transport, store, or modify the product or service.
The initial design required the system to take fluid from the pressurised tank, filter it through the filter rack, and deliver to a lower pressure staging tank at a rate of 375 litres per minute.
The pump trim was well selected, as the pump curve in Figure 2 shows the operating point to be almost exactly on the best efficiency point (BEP) for that pump.

Figure 2: Filter unit pump curve operating in as-designed condition.
If demand for the product of this process unit was doubled to 750 litres per minute, the engineer has a number of options to consider.
However, since the unit is in operation and the engineer is not completely sure of the consequences of component changes on the entire system, flow simulation software provides a way to investigate without impacting production.
In Figure 1, over 660 litres per minute are flowing through the recirculation line; it would seem simply throttling that flow by closing the valve on that line would divert sufficient flow through the filter rack to add the additional 375 litres per minute required.
The engineer reduces the flow through the recirculation valve and discovers that even with the valve completely closed, the flow through the filter rack only increases to around 390 litres per minute (Figure 3). Clearly this is not a viable solution.

Figure 3: System behaviour with recirculation valve closed.
Instead of closing the recirculation valve, the engineer looks to simply open the process control valve but discovers that, with the valve open 100 per cent, the system can only achieve a flow of 700 litres per minute.
It becomes clear that adjusting a single valve will not achieve the desired flow rate. Closing the recirculation valve and opening the process control valve to a little over 60 per cent open results in the desired flow.
At this point the engineer may feel like they have reached a solution, but a quick look at where the pump will be operating on the pump curve (Figure 4) reveals the operating point to be well off the BEP and, if this solution had been implemented instead of simulated, the pump would have experienced significant cavitation resulting in high vibration and impeller damage.

Figure 4: Pump operating point with valves adjusted to 750 litres per minute.
Fortunately the engineer does not have to test and discover the impacts of the myriad of possible changes the hard way in the live system, and through multiple iterations settles upon the solution shown in Figure 5 and Figure 6: changing out the pump impeller from a 240mm trim to a 260mm trim, adjusting the recirculation valve back to 10 per cent open, and setting the process control valve to just under 51 per cent open.

Figure 5: Final system configuration with new impeller trim and valve adjustments.
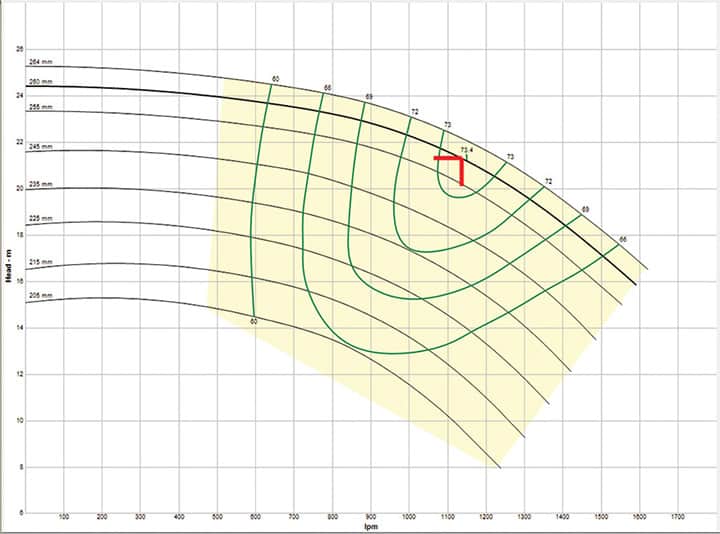
Figure 6: Pump curve with 260mm trim and valve adjustments.
As can be seen, the desired process flow rate has been achieved and the pump is operating at its BEP.
The pump, control, and process elements in a piping system are interdependent and changes that might seem simple often have unintended and unforeseen consequences as seen in the simple example system discussed here.
In most actual systems, the number of components and their interactions are much more complex, making it even more important to look at the system as a whole and not as individual elements.
Readily available tools such as system simulation and analysis software make this task simpler, saving both engineering and production time as well as enabling determination of a solution that is optimised for performance, cost, and implementation.
Ray T Hardee, PE, is the Chief Engineer and a principle founder of Engineered Software Inc., creators of PIPE-FLO® and PUMP-FLO ® software. The PIPE-FLO product line helps some of the largest companies across a variety of industries find hidden profit in the design and operation of their fluid piping systems through simulation software, modeling services, and training opportunities. Hardee is a member of the Hydraulics Institute, ASME Energy Assessment for Pumping Systems standards committee and ISO Pumping System Energy Assessment committee. Hardee’s publications include Piping System Fundamentals and contributions to HI’s Pump Life Cycle Cost and Optimizing Piping Systems. He can be reached at [email protected].


