


by Troy Leyden, Operations Engineer, Fitzroy River Water
It is well known that a variable speed drive (VSD) can be used to reduce energy consumption by slowing down a pump instead of throttling a valve to deliver the desired flow rate. But what savings could be achieved if a VSD was installed? If a VSD has already been installed, under what conditions does slowing down a pump actually increase the energy consumption?

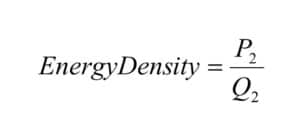
In practice, a supervisory control and data acquisition (SCADA) package can be used to trend the power consumed in kilowatts (kW) divided by the flow rate in megalitres per hour (ML/h) to give a useful result for real-time comparison. That term is referred to in this article as energy density (ED), and is expressed in kilowatt hours per megalitre (kWh/ML) pumped.
Furthermore, the ED for a given duty can be readily calculated or supplied by a pump manufacturer, but what about across the range of flow rates? Or even comparing pumps across a range of flow rates?
Typically, the design duty includes various contingencies to ensure a pump with sufficient capacity for the design life of the pump station is chosen. For a municipal water provider, these contingencies may include factors such as forecast connection increases, seasonal demand variations, and possibly also fire fighting capacity. For the majority of the life of the pump this demand will not be required, so the pump could be turned off, or, if a VSD has been installed, it could be slowed down.
If a VSD has not been installed there is no possibility to review the actual ED, so how can the potential benefit of a VSD be reviewed? For centrifugal pumps, one method is the following mathematical model that can be utilised with a spreadsheet program such as Microsoft Excel.
Information required:
- The pump curve in the form of a quadratic (second order polynomial) equation. Any order polynomial equation can be used, but quadratics seem to fit reasonably well, so for this example that will be the form utilised.
>> Spreadsheeting programs allow a bunch of data points from the pump curve to be inputted, and the program will give the equation of the line of best fit, most likely in the form of y=ax2+bx+c. Ensure that the pump head (H1) is the y-axis and flow rate (Q1) is the x-axis. This will give the pump curve in the form H1=aQ12+bQ1+c.
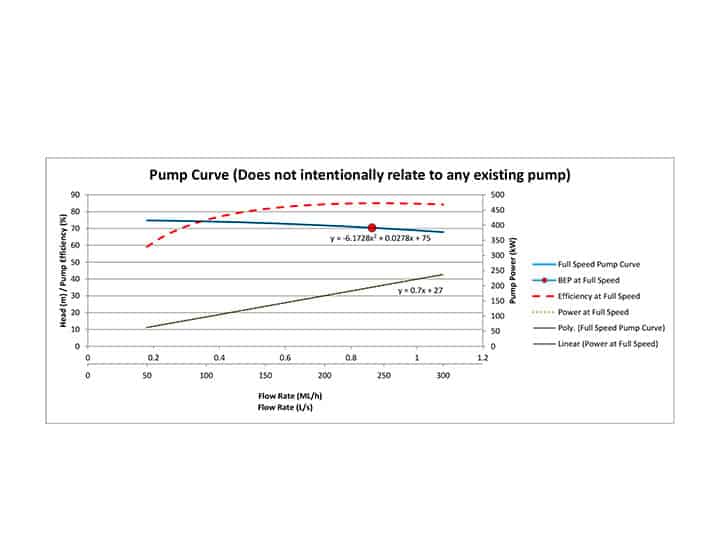
Figure 1. Pump Curve used for these examples.
- The pump power curve, usually also found on the pump curve graph. For this example, a linear equation will be used. Again, any order polynomial can be adapted.
>> Typically a linear equation is denoted as y=mx+c, but to avoid confusion, d will take the place of m, and e will be used instead of c to give y=dx+e. Make sure the x-axis is in the same units as were used for the pump curve, and the equation should look something like P1=dQ1+e.
- The system curve. This can be in the form of an equation, or it can be observed flow rates in one column and the associated system head required in a second column.
>> The system curve is presented using Q2 for flow rate and H2 as the system head at the flow rate Q2.
>> Make sure the units for Q and H for both the pump curve and the system curve are the same or the equations presented will not work.
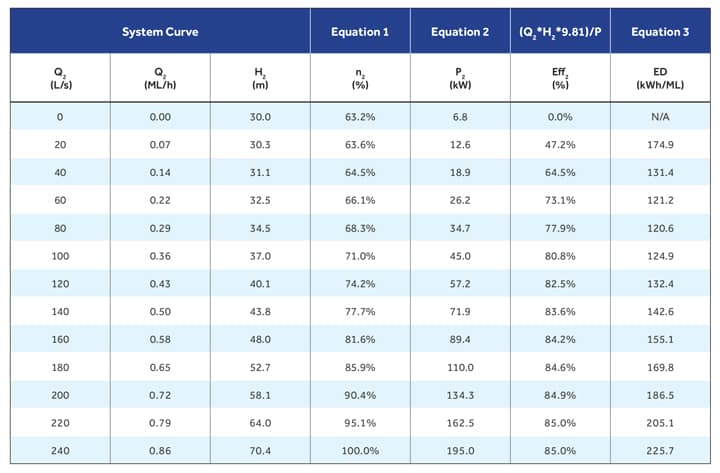
Table 1. System 2, 30m static head design duty 240L/s at 70.4m.
Once the required data has been obtained, equations 1, 2, and 3 (shown later) can be calculated and a table such as Table 1 can be generated. A graph of the results is also shown in Figure 2.
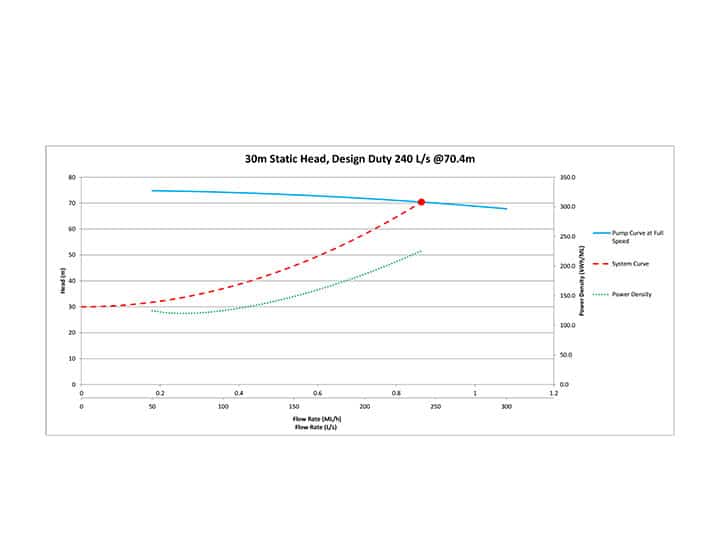
Figure 2.
Analysing the data
What does that chunk of data tell us? Well, the minimum ED is at 80L/s, so there would be no benefit running the pump any slower than 68.3 per cent, or somewhere in the vicinity of 34.2Hz, based on 50Hz being what the full speed pump curve was based on.
It also tells us that if the pump is run at 120L/s all day instead of 240L/s for half a day, that we will save more than 40 per cent of the energy to pump the same volume.
So, the three main equations required are:
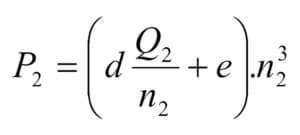
Equation 1:
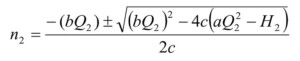
Equation 2:
Equation 3:
Which may seem a bit daunting, but once the equations are entered correctly, they can be copied and modified as required for different pumps and systems.
Care needs to be taken when reviewing the results to ensure the pump, motor and VSD are all within their application range. Also, the results are the theoretical pump power, and do not take into consideration any other losses that will cause increased energy consumption.
The results, when correct, are an indication only of the flow rate that will offer the optimal ED for a given pump in a given system, any discrepancies will cause the results to be inaccurate, and the results are not always replicated in practice as the theory suggests they should be. But it is a modelling tool that can be very useful nonetheless.
It can be seen that the potential benefits are best for systems with high dynamic losses (see Figure 3). While that might justify the expense of a VSD, the best long-term strategy to reduce energy consumption may be to reduce the dynamic losses.
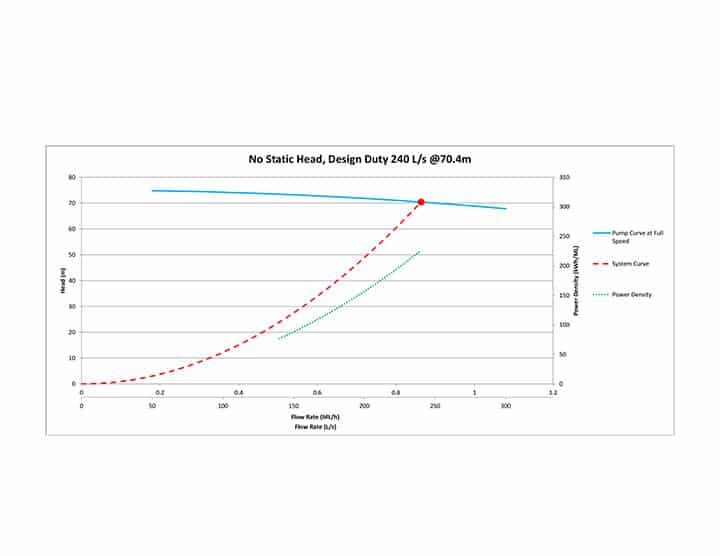
Figure 3.
For systems with high static head compared to dynamic head losses, the benefits of slowing the pump may not be as great. But performing this analysis will indicate the point where pumping at a slower flow rate not only consumes more energy, but is also no longer within the application range of the pump.
Figure 4 shows such a system, and it can be seen that while there is a degree of benefit to slowing the pump down during periods of low demand, there is a risk of slowing down too much. At 50L/s the pump efficiency has fallen from 85 per cent at the design duty to 62 per cent, which is reflected in the increase in ED at this flow rate. Besides excessive energy consumption, running the pump at this flow rate could be causing excessive wear, potentially leading to premature maintenance tasks being required.
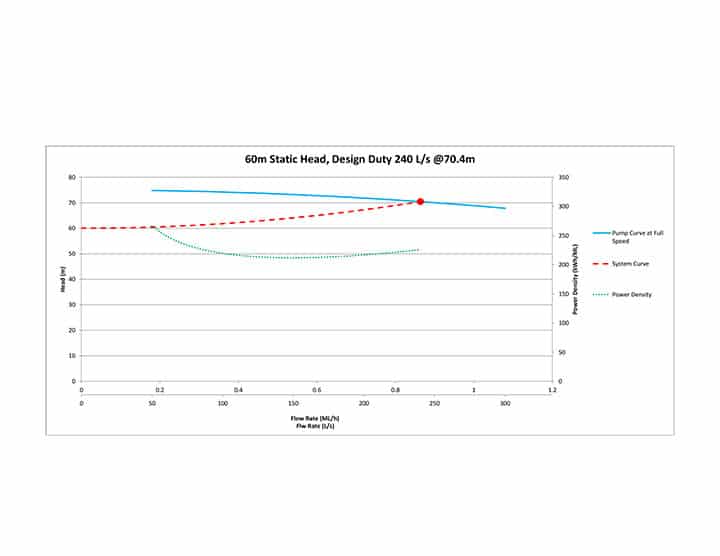
Figure 4.
Conclusion
VSDs are increasingly becoming commonplace. The cost of the VSD has reduced so much in recent years that the energy savings in as little as a year may cover the cost of the unit. Unfortunately, they also lend themselves to allowing pumps to be operated outside their range of application.
By using the supplied equations and a moderate investment of time to get them working, a useful engineering tool can be made. Care needs to be taken when interpreting the results produced, and the results need to be viewed as an indication only of the pump performance at the given duty.
However, by reviewing pump performance across a range of flow rates, there is the potential to reduce energy consumption and increase pump life through operational changes. Not a bad investment.
Find Motors, Drives And Engines Related Companies In The Pump Industry Capability Guide


-
Artificial intelligence improves pump efficiency at Melbourne Water treatment plant
Winneke treatment plant, located in the hills north east of Melbourne, was commissioned in the early 1980s to provide...
-
Interaction of components in piping systems
by Ray Hardee, Chief Engineer, Engineered Software Piping systems are often called upon to deliver product or services that...
-
A digital leap: Shoalhaven Water’s SCADA upgrade
Shoalhaven Water (SW) is now concluding a three-year multi-generational leap in its remote telemetry systems. SW had identified the...
-
Pumping up Dubbo’s assets
Dubbo Regional Council in New South Wales’ Orana Region has been undertaking a range of upgrades, and water and...
-
Pumps and fuel efficiency
A comprehensive testing program of conventional large mixed flow pumps typically used on cotton irrigation farms has found that...
-
Pump school: Single versus parallel operation of centrifugal pumps
Parallel operation may be required to meet variable demands, such as flood control, or to satisfy a temporary condition that...
-
How important is the reliability of your pumping system?
One of the most important stages in the life of a pump is when it’s first installed which is...
-
Feedback sought on ISO 14847:1999 and ISO 5198:1987
The International Standards Organisation (ISO) has requested feedback via Standards Australia on two “aged” pump standards i.e. a standard...


