


by David Cowan, Hydraulics Engineer, ITT Goulds Pumps; Simon Bradshaw, Director of API Product Development & Technology, ITT Goulds Pumps; and Thomas Liebner, Hydraulics Engineer, ITT Goulds Pumps
Today’s most commonly used limitations for suction specific speed and the well-accepted relationship between suction specific speed and vibration are based on studies undertaken in 1982 and 1985, respectively. A recent study sought to revisit the tests and examine them in relation to changes in impeller design techniques and the improved design and construction standards that have been introduced since the experiments were originally undertaken.
Re-examining accepted knowledge
The most commonly used hard limitation for pump suction specific speed is 11,000 (US units). This hard limit grew out of the recommendations from a 1982 reliability study by J.L. Hallam (Hallam 1982). Following this, testing of the vibration performance of an OH2 4×6-11 pump occurred using impellers designed for different suction specific speeds (Lobanoff and Ross 1985). This study showed that all things being equal, a strong relationship existed between suction specific speed and the pump vibration at off best efficiency point (BEP) operation.
Given that significant changes have occurred in impeller design methods and computational tools during the subsequent three decades, a group of researchers decided the time was ripe to examine how these new methods/tools have affected the relationship between suction specific speed and pump vibration.
To do this, they performed experiments using a series of impellers designed for different suction specific speeds using modern design techniques. These impellers are mounted in a subject test pump also an OH2 4×6-11 in order to be comparable to the original tests). Vibration performance over the pump operating range was then recorded. Computational fluid dynamic (CFD) analysis was then used to further examine the performance of each impeller.
Developing the suction specific speed/vibration relationship
The suction performance of a centrifugal pump is an extremely important consideration for optimal pump performance. Good suction performance allows for the use of smaller piping, lower tank elevations, less excavation and a general optimisation of plant design. These optimisations can lead to significant cost savings.
From the 1950s to 1980s the impeller design methods available to pump designers were more limited than they are today. Impeller designs from that era were notable for achieving good suction performance through the use of large impeller inlet diameters (D1). It was not understood until later that enlarging the impeller inlet diameter impaired the impeller performance at flow rates lower than the best efficiency point (BEP). This impairment exhibited itself as significantly increased vibration and in some extreme cases an unstable NPSHr characteristic.
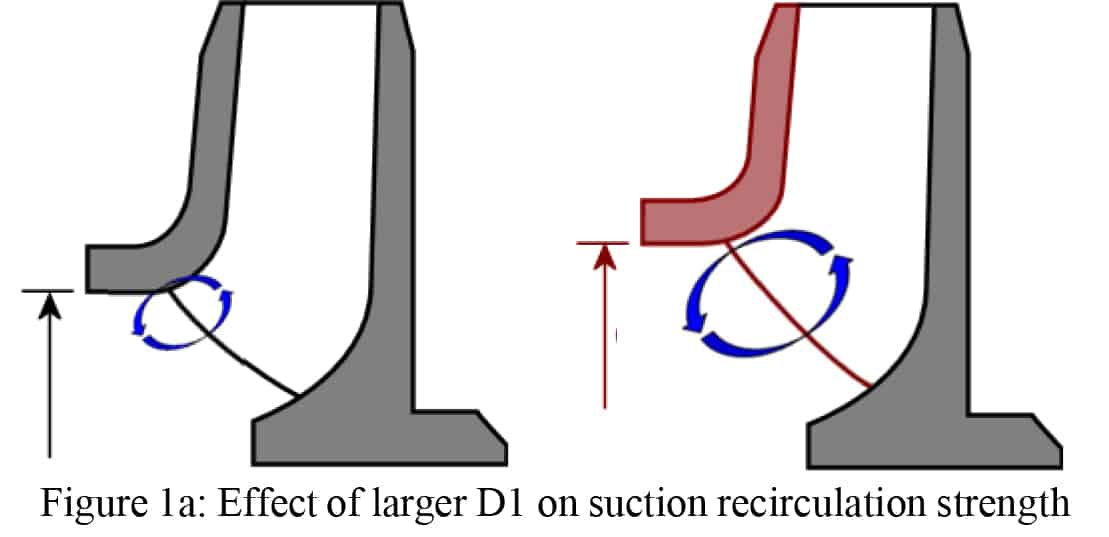
Figure 1a. Effect of larger D1 on suction recirculation strength.
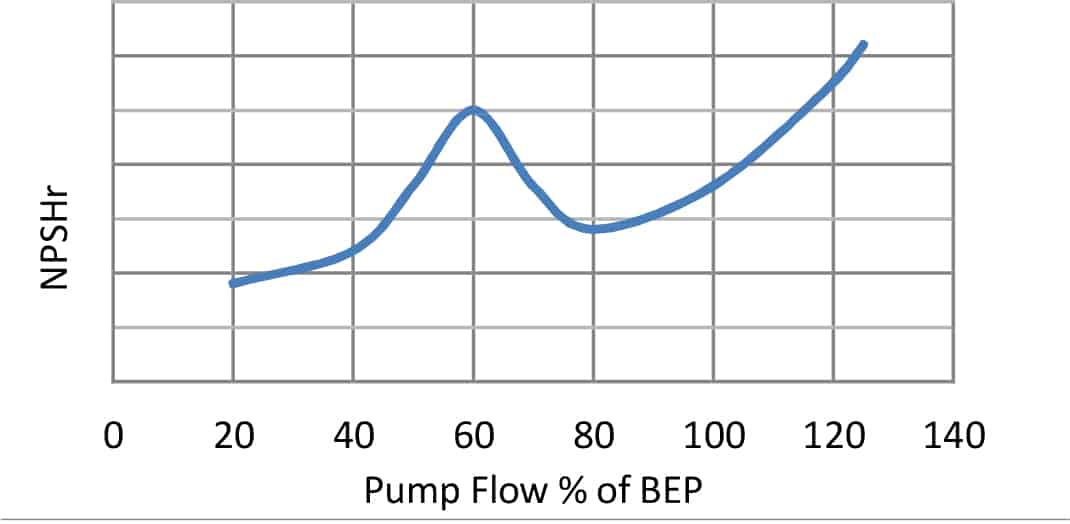
Figure 1b. Unstable NPSHr characteristic.
The landmark paper by Warren Fraser (Fraser 1981) brought the consequences of relying on large impeller inlet diameters into focus. Pump users had already become increasingly concerned that while such designs minimised plant first cost, it was at the price of reliability and overall life cycle cost. However, no large scale study of the phenomenon in an actual pump population had occurred and hence the nature of the trade-off between suction performance and reliability was unclear.
This changed when Jerry Hallam (Hallam 1982) published the results of a large scale reliability study of 480 pumps over a five year period at the Amoco Texas City refinery. He found that the reliability of a pump was meaningfully related to its suction specific speed (Nss). Specifically pumps with an Nss>11,000 (S>213) failed twice as often compared to lower suction specific speed pumps. Figure 2 shows the failure rate versus suction specific speed.
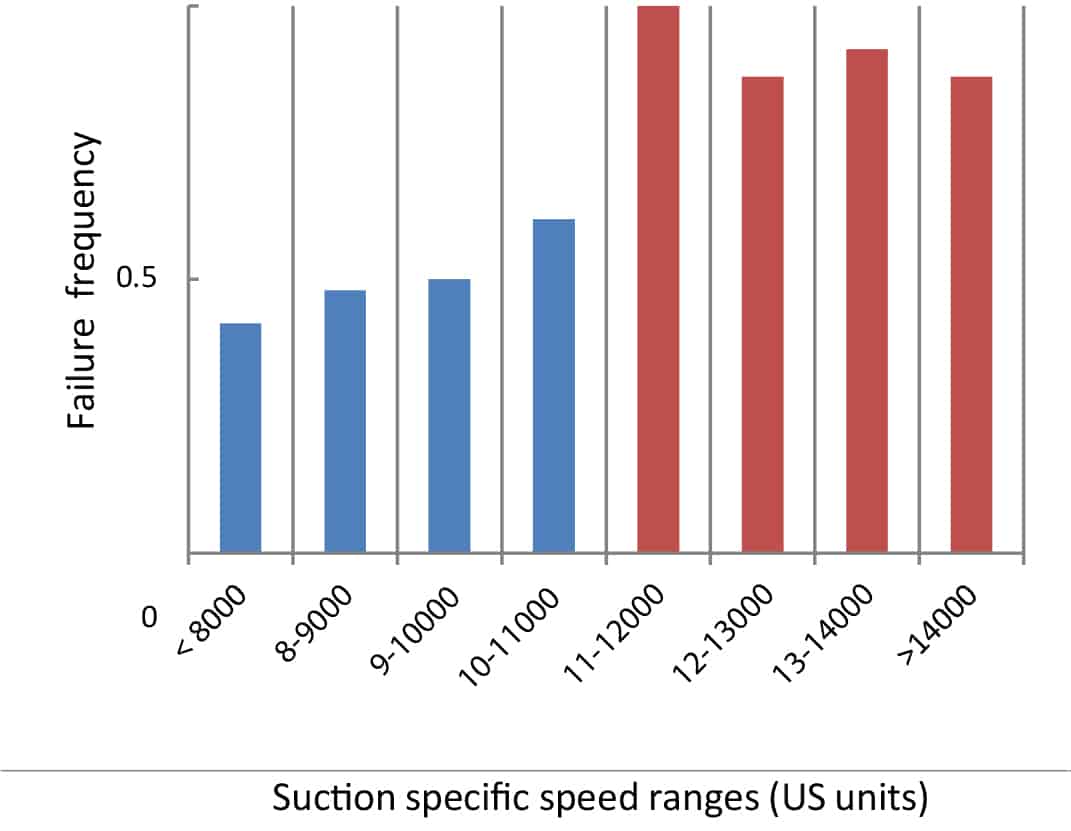
Figure 2. Failure frequency vs suction specific speed.
Hallam concluded “This study indicates that caution should be exercised when purchasing hydrocarbon or small water pumps with a Nss greater than 11,000 unless operation is closely controlled near BEP”.
This conclusion was supported by the results of testing an OH2 configuration 4×6-11 (100×150-280) pump in the book Centrifugal Pumps: Design & Application (Lobanoff and Ross 1985). For this testing a series of eight impellers with differing suction specific speeds were designed and tested at 3560 RPM. The range of suction specific speeds varied from Nss=7000 (S=135) to Nss=20,000 (S=387). For each impeller the flow was varied until the pump vibration level exceeded the API 610 allowable level of 0.3 inches/sec (7.6 mm/s) peak. Those limiting flow rates are shown for each impeller in Figure 3.
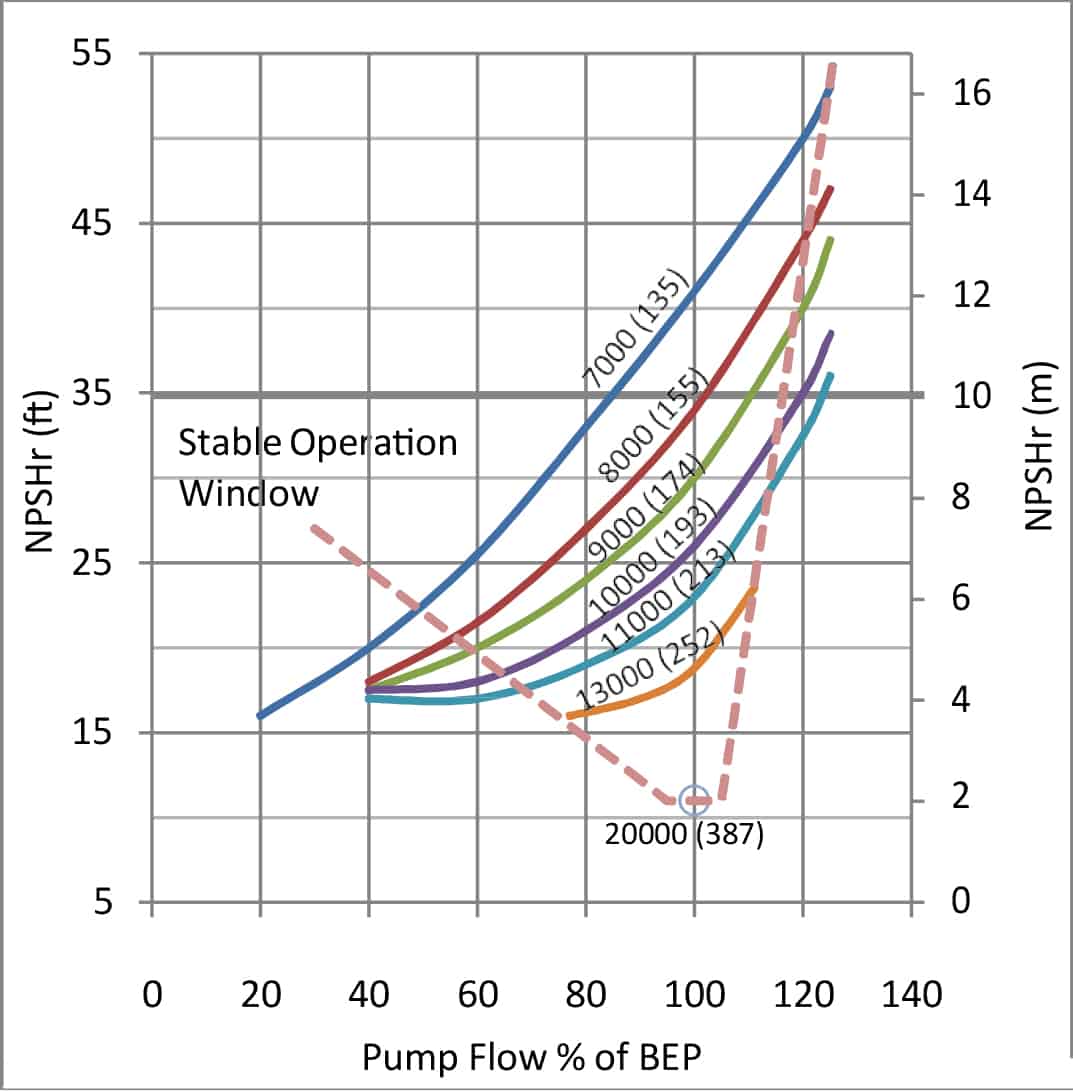
Figure 3. Stable window according to Lobanoff & Ross.
The testing showed that the impeller operating range with acceptable vibration characteristics was strongly related to suction specific speed.
In the years following the publication of Hallam’s work the Nss=11,000 (S=213) limit was widely adopted as a hard limit in the oil and gas industry to the extent that it is rare to see a specification that does not invoke it in some form. It is common to see the limit applied rigorously to the extent that (for example) a pump with Nss=10,950 (S=212), is viewed as acceptable while a pump with Nss=11,050 (S=214), is viewed as unacceptable.
A number of authors have over the years studied and reported that the influence of suction specific speed on pump reliability is now diminished [(Stoffel and Jaeger 1996), (Hirschberger and James 2009), (Hergt et. al. 1996), (Gulich 2001) and (Balasubramanian et al. 2011)]. Central to their claim was the premise that modern impeller design techniques, all else remaining unchanged, allowed attainment of higher suction specific speeds without resorting solely to enlargement of the impeller inlet diameter. However none of this work has altered the widespread view that the original Nss=11,000 (S=213) number is the main criteria that should be used in assessing a pump’s quality.
It is noticeable (by its absence), that no similar follow-up large scale study of refinery pump reliability has taken place in the past 30 years. This is concerning, given the increased emphasis on safety, life cycle cost and minimising emissions.
Changes in impeller design techniques
Impeller design techniques and tools have improved significantly in the last 30 years, allowing impellers to attain a required suction performance while minimising the increase in impeller inlet diameter.
While not intended to be an exhaustive list, some of the design options available to today’s designers include:
• Small incidence blade angles coupled with small blade and approach flow angles (for better NPSH behaviour at part-load operation).
• Low blade loadings in the inlet region up to the impeller throat area. These help prevent the formation of low pressure zones where cavitation will begin.
• S shaped developments of the impeller camber line in order to achieve the required impeller throat area while minimising the eye diameter.
• Backward swept blades to reduce the volume of any cavitation that develops at the leading edge.
• Impeller leading edge carried well forward at the impeller hub in order to reduce the formation of cavitation at part load operation.
• The deployment of better controlled leading edge profiles. These profiles effectively limit the leading edge pressure spikes and are less sensitive to part load operation. For example prior research by the author’s company (Balasubramanian et al. 2011) has shown that optimised impeller leading edge profiles improve suction specific speed without requiring larger impeller inlets.
• Utilising computational analysis techniques the impeller inlet design can be optimised for a given set of conditions, thus allowing greater control and understanding of the flow and pressure characteristics in the impeller passageway.
Changes in design and construction standards
Pump standards (e.g. API 610 11th edition), have continued to evolve and modern designs are more robust than designs existing in the 1980s.
Specifically, the L3/d4 ratio has been reduced in order to limit shaft deflection at the seal chamber to 0.002” (0.05mm) under any operating condition. L3/d4 is calculated from the impeller overhang (L) divided by the shaft diameter at the mechanical seal (d), see Figure 4. This mechanical constraint was driven by the need to improve mechanical seal reliability and the use of L3/d4 as a cost factor weighting representing lifecycle cost.
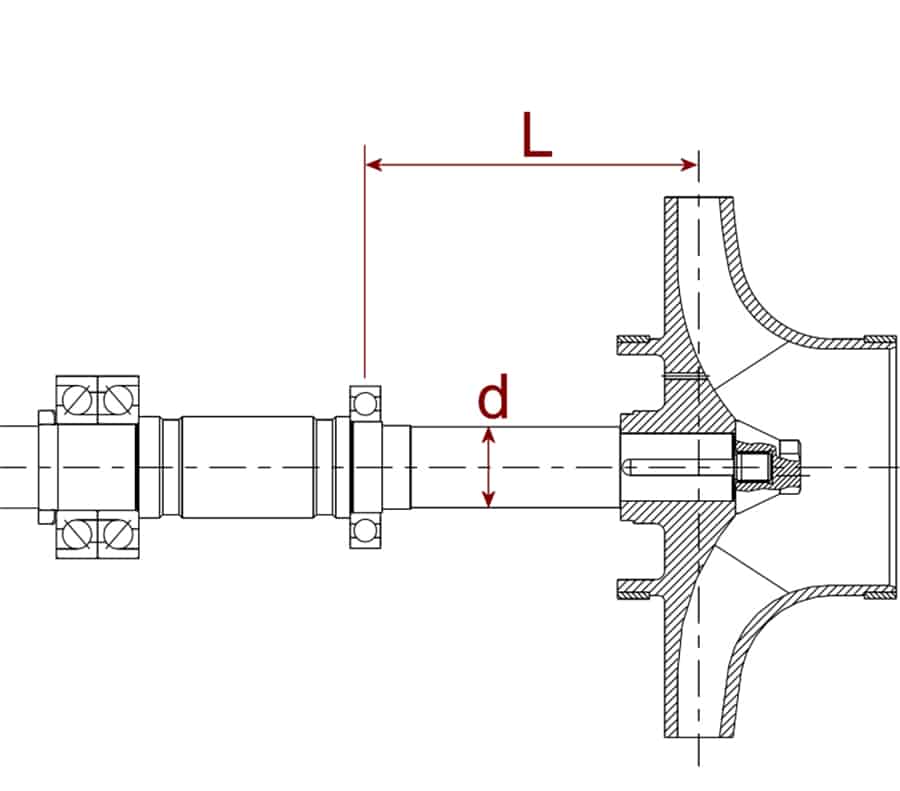
Figure 4. L3/d4 for an overhung pump rotor.
It is not unusual to see pumps designed to earlier versions of API 610 having L3/d4 ratios that are three to six times higher than the industry average today. For example, in a comparison between the 4×6-11 (100×150-280) tested in this paper and a similar pump from a model line designed to an earlier version of API 610, the older design had an L3/d4 of 213 in-1 (8.4 mm-1). This is five times greater than the value of the pump tested for this paper, which has an L3/d4 of 42 in-1 (1.65 mm-1).
API 610 11th edition introduced non-binding criteria for L3/d4 in Appendix K of the standard. The criteria plots L3/d4 versus a factor composed of the pump flow x head/speed. The location of the test pump is plotted on the graph in Figure 5 as compared with an older generation pump.
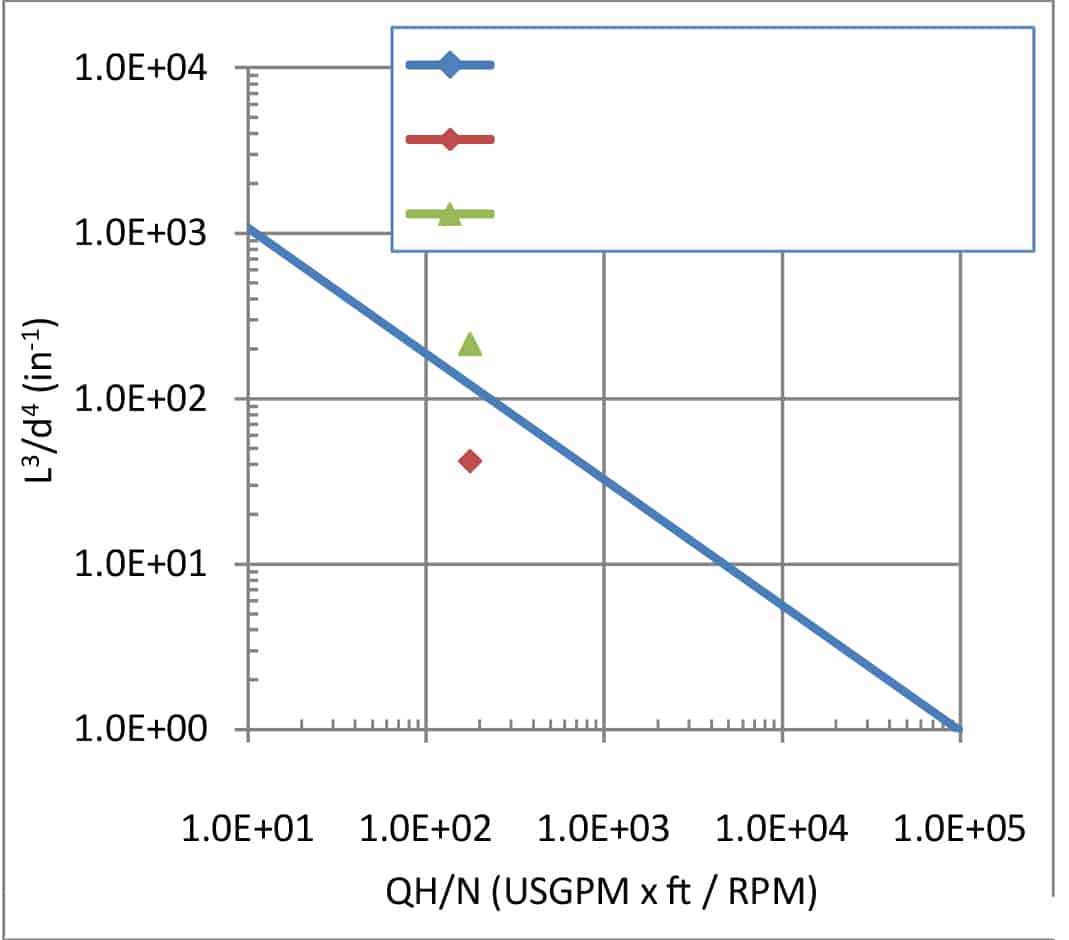
Figure 5. Excerpt from API 610 11th edition Appendix K.
API 610 7th edition (1989) also introduced the current requirements for limiting the deflection of the pump under specified nozzle loads including optional testing. API 610 9th edition (2003) specifically prohibited the use of rear bearing housing supports on OH2 pumps. This required an improvement of the overall rigidity of the pump casing, bearing frame and baseplate.
Figures 6 and 7 contrast the arrangement of a casing foot typical of current designs with that of an older design. Consequently the improved rigidity tends to improve overall pump reliability and vibration performance.
-

- Figure 6 . Pump foot fully compliant to API 610 11th edition.
-

- Figure 7. Pump foot design typical of a pump designed to pre-API 7th edition standards.
Hence it was timely to examine how these changes have affected the attainable acceptable flow range as it relates to suction specific speed.
Test pump setup
The test pump selected for the study was a 4×6-11 (100×150-280) in a single stage overhung configuration with centreline mount (OH2). It was fully compliant with 11th edition of API 610. In terms of overall construction it was unremarkable though consistent with the current best practice for a full compliant API 610 OH2 design. Figure 8 shows a cross-sectional view of the test pump.
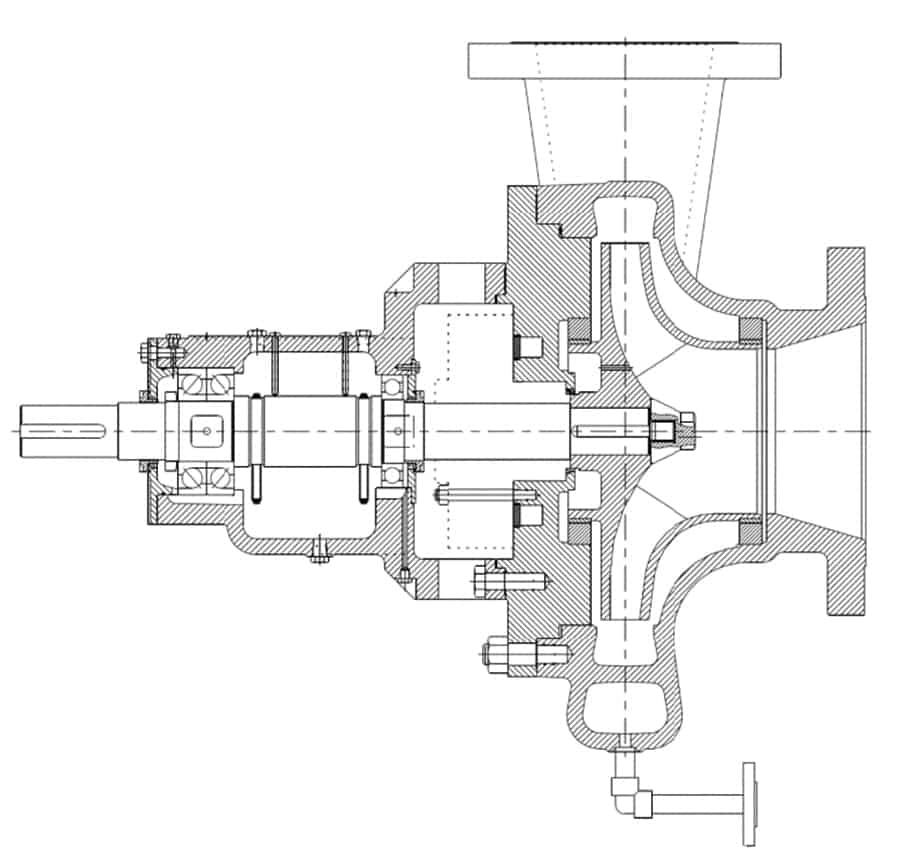
Figure 8. Cross-sectional assembly of the Test Pump.
The characteristics of the test pump are listed in Table 1.
|
Parameter |
Value |
|
Running Speed |
3560RPM |
|
BEP Head |
450ft (137m) |
|
BEP Flow |
1670 USGPM (380m3/h) |
|
BEP power @ 1.0 SG |
232HP (173kW) |
|
Specific Speed Ns (nq) |
1489 (28.8) |
|
Design Pressure |
750 psig (51.7 barg) |
|
Materials of Construction |
API 610 code S6 |
|
Shaft dia. @ mechanical seal |
2.362” (60mm) |
|
L3/d4 ratio |
42 in-1 (1.65 mm-1) |
Table 1. Test Pump Specifications.
The pump was installed in a standard testing station in the large hot water tank (LHWT) test loop of company’s R&D facility. The test setup complied with HI 14.6 test standards. Figure 9 shows the test pump as installed in the test loop. It is important to note that all test loop setups are temporary constructions and the vibration levels measured on the pump will necessarily be higher than those achieved in the final site installation. The absence of a large permanent foundation and grout reduces the ability of the test setup to attenuate these vibrations effectively. Additionally, all of the fluid energy imparted by the pump needs to be dissipated within the test loop. This tends to cause vibrations that are fed back to the pump, and in extreme cases acoustic resonances can occur in the typically short pipe runs.
-

- Figure 9a. Pump installed in the test loop.
-

- Figure 9b. Pump installation (bearing housing view).
Hydraulic Institute recognises this fact in their vibration standard 9.6.4, which has higher allowable levels for factory testing than for site testing. API 610 makes no such distinction and requires the same low levels be achieved in the factory test loop as in the final permanent site installation.
For the purposes of the testing, the allowable vibration levels shown in Table 2 were used, in accordance with API 610 11th edition.
|
Parameter |
Vibration level |
|
Overall unfiltered in the flow range 70{87a03eb4327cd2ba79570dbcca4066c6d479b8f7279bafdb318e7183d82771cf} to 120{87a03eb4327cd2ba79570dbcca4066c6d479b8f7279bafdb318e7183d82771cf} of BEP |
0.12 in/s (3.0 mm/s) |
|
Any discrete frequency in the flow range 70{87a03eb4327cd2ba79570dbcca4066c6d479b8f7279bafdb318e7183d82771cf} to 120{87a03eb4327cd2ba79570dbcca4066c6d479b8f7279bafdb318e7183d82771cf} of BEP |
0.08 in/s (2.0 mm/s) |
|
Overall unfiltered in the flow range MCSF to < 70{87a03eb4327cd2ba79570dbcca4066c6d479b8f7279bafdb318e7183d82771cf} and > 120{87a03eb4327cd2ba79570dbcca4066c6d479b8f7279bafdb318e7183d82771cf} of BEP |
0.156 in/s (4.0 mm/s) |
|
Any discrete frequency in the flow range MCSF to < 70{87a03eb4327cd2ba79570dbcca4066c6d479b8f7279bafdb318e7183d82771cf} and > 120{87a03eb4327cd2ba79570dbcca4066c6d479b8f7279bafdb318e7183d82771cf} of BEP |
0.10 in/s (2.6 mm/s) |
Table 2. Vibration criteria for acceptable performance under API 610 11th edition.
These vibration values would be used to determine the allowable operating range of each impeller.
Impeller design
For the test rig, four single entry end-suction impellers were designed. Details of the key geometry information are tabled below. Constraints were placed on the maximum outlet width dimension to ensure each impeller could fit within the standard 4×6-11 case being utilised as well as ensuring similar radial thrust values.
The impellers were designed with varying suction specific speed (Nss) constraints, notably 8,000 through 15,000, with the intent to maintain a standard generated head and best efficiency flow rate.
Maintaining a similar meridional geometry between impellers is not possible due to the large increases in suction specific speed. As such, the impeller eye diameters gradually increase causing differences in the overall meridional shape.
There was some variation in discharge angle and discharge width between the different designs. B2 and β2 are strongly dependent, and were adjusted to achieve the appropriate discharge area while accommodating the variation in inlet geometry.
The inlet diameter for the highest Nss impeller was almost 20 per cent larger than the lowest Nss design. An overlay of each of the impeller meridional shapes can be seen in Figure 10.

Figure 10. Overlay of meridional geometries.
As discussed previously, in research by the authors’ company (Balasubramanian et al. 2011), it was demonstrated that cavitation is better controlled and higher Nss values achieved by employment of optimised leading edge profiles. As such, a parabolic leading edge profile was adopted for each of these designs, but the benefit of the leading edge profile was not considered in the impeller design calculations (and impeller design system utilised for these designs), as the exact improvement that could be realised was uncertain.
To reduce variability between the impellers, a constant wear ring diameter has been used (see Table 3). Wear ring clearances were in conformance to API 610 11th Edition Table 6.
| Design 1 | Design 2 | Design 3 | Design 4 | |
| Nominal Nss (S) | 8000(155) | 11,000(213) | 13,000(252) | 15,000(290) |
| D2 Impeller outlet diameter (in) | 11 | 11 | 11 | 11 |
| B2 Impeller outlet width (in) | 1 | 0.9 | 0.85 | 0.95 |
| β2 Impeller vane angle @ outlet (deg) | 24 | 26.3 | 29 | 27.5 |
| D1 Impeller inlet eye diameter (in) | 4.9 | 5.3 | 5.5 | 5.8 |
| β1t Impeller vane angle @ inlet (deg) | 29 | 13.2 | 14.7 | 11.7 |
| D1 / D2Impeller inlet / impeller outlet dia. | 0.44 | 0.48 | 0.5 | 0.53 |
Table 3. Basic dimensions for the four impeller designs.
In standardising the wear ring geometry the consequential volumetric loss is constant across the four impellers. This ensures a standard fluid damping effect. Wear ring length has been held constant across the impellers to normalise the favorable centering ‘Lomakin’ effect. While API 610 does not allow this effect to be considered when calculating the shaft deflection, it does provide some additional stiffness and damping and hence it was necessary to keep it constant for all impeller designs.
The impellers were manufactured directly from the 3D model using rapid investment casting techniques (pattern less manufacture) and the cast impellers using SLA rapid prototyping process. Pictures of the resulting impellers are shown in Figures 11a to 11d.
-

- Figure 11a. Nss= 8000 nominal impeller.
-

- Figure 11b. Nss= 11000 nominal impeller.
-

- Figure 11c. Nss= 13000 nominal impeller.
-

- Figure 11d. Nss= 15000 nominal impeller.
Computational fluid dynamics (CFD)
To verify the hydraulic designs, a computational study, conducted within the framework of the ANSYS-CFX solver, [ANSYS CFX-14.5, 2012], was undertaken. The initial motivation for the computational analysis was to ensure that each design achieved its target Nss at the best efficiency point (BEP) while maintaining comparable performance. Additionally, the CFD results can provide insight into the development of cavitation on the leading edge of the blade and into the onset of recirculation within the impeller. The onset of suction side recirculation as the flow rate through the impeller is reduced should signal an increase in vibration characteristics.
For simplicity, a single blade-centered passage with a steady-state flow condition was utilised for this analysis. This has certain limitations as it neglects the effect of the casing and any unsteady characteristics including blade pass and system response. However, it makes the size of the mesh and the time to convergence manageable so that multiple flow conditions could be analysed.
Mesh Structure
An unstructured mesh with tetrahedral mesh elements was generated using the Simmetrix grid generation software [Simmetrix MeshSim, 2012]. A boundary layer mesh with hexahedral mesh elements was placed on wall surfaces. A minimum ∆y was established such that the average y+ value on the vane surface was between 10-20. The k-ω model with the shear stress transport (SST) adaptation is utilised to model the turbulence and near-wall structures. For this turbulence model, a y+ of less than 30 has produced repeatable results while sufficiently capturing the near-wall characteristics. The global size is chosen as 0.015x the maximum length of the passage. This allowed for an average of 5 cells across the width of the passage. The mesh size for the four models varied between 450,000 and 600,000 nodes.
A grid refinement study was performed for one of the design cases to ensure that the mesh was properly constructed and would produce results of sufficient accuracy. Three meshes of increasing refinement were utilised. The results of this sensitivity study are described in Table 4.
|
Mesh Size |
Predicted Head |
Predicted 3{87a03eb4327cd2ba79570dbcca4066c6d479b8f7279bafdb318e7183d82771cf} NPSHr |
|
Nodes |
Ho/Hnu |
NPSHr/NPSHrnu |
|
164,000 |
1 |
1.19 |
|
332,000 |
0.99 |
1.05 |
|
590,000 |
1 |
1.01 |
|
p |
-2 |
-2 |
|
eh |
5.33 |
-2.67 |
|
Hnu /NPSHrnu |
509.3 |
13.83 |
Table 4. Mesh refinement sensitivity study.
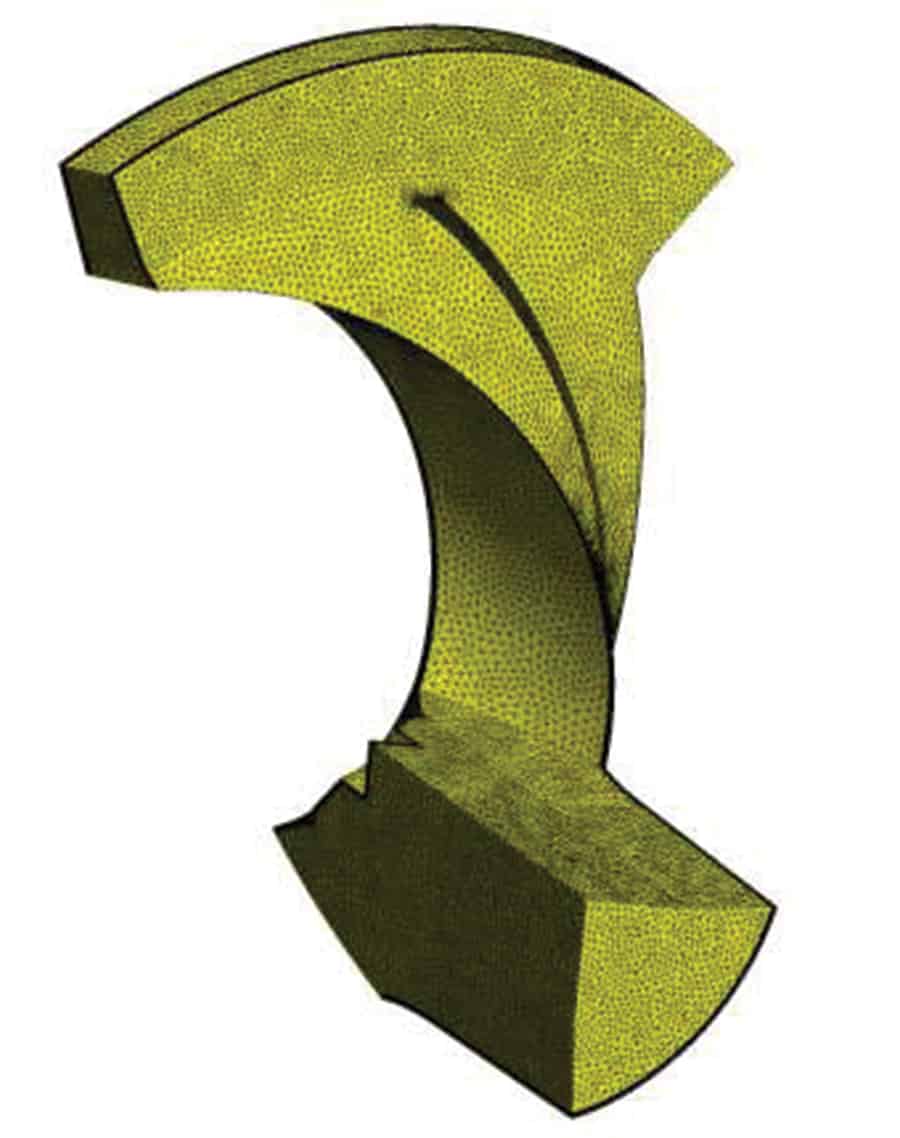
Figure 12. Sample mesh used during computational study.
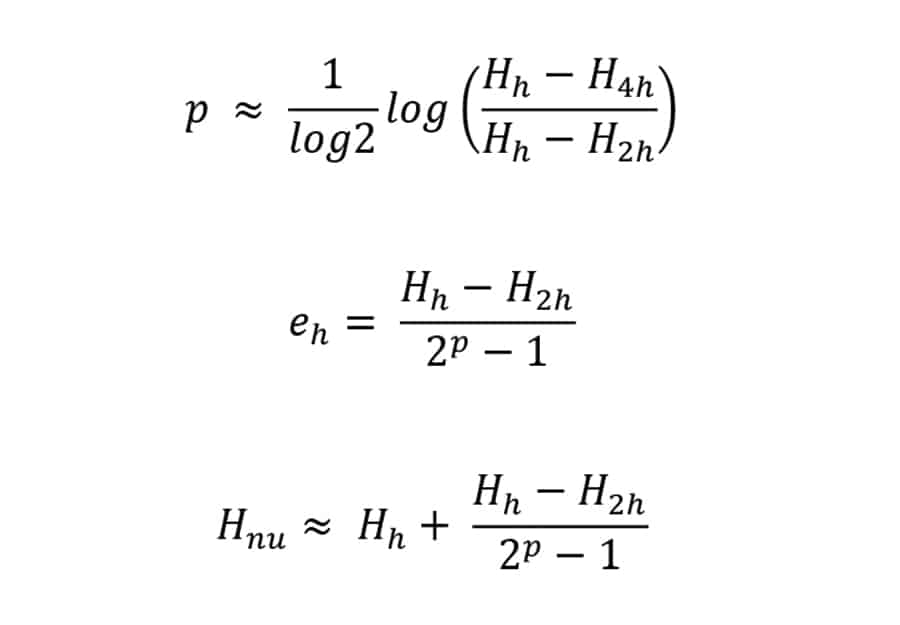
As described in the book Centrifugal Pumps by Johann Güilich, approximating a grid independent solution (Hnu), the discretisation errors (eh) and the order (p) of the solution can be calculated utilising solutions of grid sizes that differ by a factor of 2. The equations are listed below.
CFD solver criteria
The analysis of the four designs was performed using the ANSYS-CFX solver. The homogeneous two-phase mixture model is employed to model cavitation. The cavitation model is based on the Rayleigh-Plesset equation with source terms for the generation and destruction (vapourisation and condensation) of vapour bubbles [Bakir et al., 2004]. The model solves for two phases, vapour phase (αvapor) and liquid phase (αwater), at each control volume location, with the sum of both phases equal to one (αvapor+αwater=1) at each location. The basic assumption of the model is that all phases share the same velocity and a mixture equation is solved for the conservation of momentum. High resolution fluxes are chosen for the discretisation of mean flow and turbulence equations. The shear stress transport (SST) turbulence model is used for modelling turbulence.
Simulations are performed for a single passage of the impeller geometry as shown in Figure 13. For the analysis, no slip boundary conditions are applied at the hub, shroud and blade; total pressure is set at the inlet with the volume fraction of water as 1.0 and vapour as 0.0; mass flow rate is specified at the exit; and rotational periodicity is applied at the periodic interfaces (passage boundaries) as shown in Figure 7.
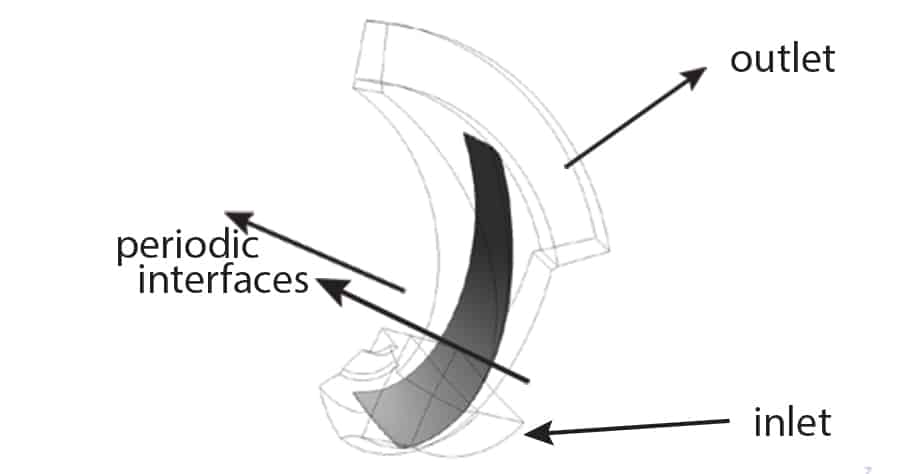
Figure 13. Single-passage CFD model for analysis.
Convergence for the velocity and momentum residuals was determined below an RMS value of 10-4. Each of the trial runs required between 200 and 400 iterations to achieve convergence.
Multiple runs were conducted for each of the impellers. Four different flow rates were investigated at 60 per cent, 80 per cent, 100 per cent, and 120 per cent of the target best efficiency point (BEP) for each of the four designs. At each of these flow rates, the inlet total pressure was gradually reduced to compute the head drop performance curves, essentially simulating a typical NPSH test run. Figure 14 demonstrates a typical head drop curve predicted by the computational analysis.

Figure 14. Typical head breakdown curve.
Prediction of recirculation by the Fraser Method and CFD
Warren Fraser (Fraser 1981), provides an estimate for the onset of suction recirculation within centrifugal pumps based on major dimensions within the impeller. The equation for this is shown below.
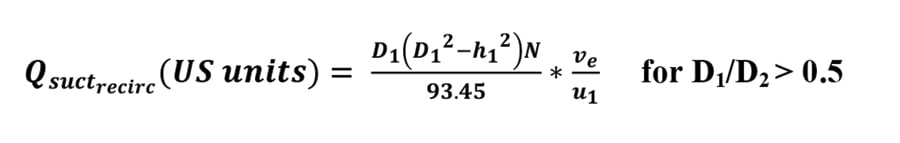
There is mention made in the paper that the equation was developed using observations of suction recirculation in a special test pump equipped with a transparent suction pipe. It is not clear from the paper as to exactly how observations made on test pumps were correlated with the resulting formula. Specifically there is no mention as to how extensive the recirculation zone must be to assure experimental observation. This makes it difficult to correlate with the CFD determinations of the recirculation zones.
Thus for the purposes of comparison, the impeller under CFD analysis is deemed to be recirculating when the recirculation zone extends upstream of the leading edge of the impeller vane, which presumably would have been observable in Warren Fraser’s test pump.
For each impeller design, single phase CFD runs were performed where the flow rate was reduced in 5 per cent increments from BEP. Figures 15a to 15d show samples of the resulting output. The results were compared for each impeller and a determination made regarding the flow at which recirculation extended beyond the vane leading edge. This flow rate was deemed to be ‘recirculation onset’.
-

- Figure 15a. Small recirculation cell ahead of vane at 50% BEP Flow, 8000 Nss (S=155) design.
-

- Figure 15b. Recirculation cell ahead of vane at 65% BEP Flow, 11,000 Nss (S=213) design.
-

- Figure 15c. Recirculation cell ahead of vane at 65% BEP Flow, 13,000 Nss (S=252) design.
-

- Figure 15d. Recirculation cell ahead of vane at 75% BEP Flow, 15,000 Nss (S=290) design.
Predictions for the onset of recirculation are shown in Table 5 for both methods. The flow rate at which suction side recirculation occurs increases with increasing suction specific speed. This is to be expected as the higher suction specific speed impellers have larger impeller inlet eye (D1) diameters.
|
Nominal Suction Specific Speed |
Fraser Suction Recirc. ({87a03eb4327cd2ba79570dbcca4066c6d479b8f7279bafdb318e7183d82771cf} of BEP) |
CFD Suction Recirc. ({87a03eb4327cd2ba79570dbcca4066c6d479b8f7279bafdb318e7183d82771cf} of BEP) |
|
8000 (155) |
48{87a03eb4327cd2ba79570dbcca4066c6d479b8f7279bafdb318e7183d82771cf} |
≈48{87a03eb4327cd2ba79570dbcca4066c6d479b8f7279bafdb318e7183d82771cf} |
|
11,000 (213) |
60{87a03eb4327cd2ba79570dbcca4066c6d479b8f7279bafdb318e7183d82771cf} |
≈63{87a03eb4327cd2ba79570dbcca4066c6d479b8f7279bafdb318e7183d82771cf} |
|
13,000 (252) |
66{87a03eb4327cd2ba79570dbcca4066c6d479b8f7279bafdb318e7183d82771cf} |
≈63{87a03eb4327cd2ba79570dbcca4066c6d479b8f7279bafdb318e7183d82771cf} |
|
15,000 (290) |
75{87a03eb4327cd2ba79570dbcca4066c6d479b8f7279bafdb318e7183d82771cf} |
≈74{87a03eb4327cd2ba79570dbcca4066c6d479b8f7279bafdb318e7183d82771cf} |
Table 5. Recirculation predictions based on Fraser & CFD.
It can be seen that the values predicted by CFD and Fraser’s equation show substantive agreement. This appears to validate the choice of CFD recirculation criteria.
Next issue: In Part 2 of this article the results of the retesting are revealed and we discover whether the limitations accepted since the 80s still apply today.
This paper was originally presented at the 29th International Pump Users Symposium at Houston, Texas in 2013. Research informing this paper was conducted at the 42nd Turbomachinery Lottery.
About the authors
David Cowan is a Hydraulics Engineer with ITT Goulds Pumps responsible for applied research and hydraulic design of engineered API process pumps. His responsibilities include the development and analysis of new and existing hydraulic products through traditional and computational methods. He is also jointly responsible for continuous development of the computational fluid dynamic analysis techniques. Prior to joining ITT Goulds, he worked as a Hydraulic Engineer for ClydeUnion Pumps. Mr Cowan has a BSc in Aeronautical Engineering from the University of Glasgow.
Simon Bradshaw is the Director of API Product Development & Technology for ITT Goulds Pumps, in Seneca Falls NY. His responsibilities include the design and development of new products and processes. Prior to joining ITT Goulds, he worked for both Sulzer Pumps and Weir Pumps, where he held various positions of engineering and contractual responsibility. Additionally he has supported the Hydraulic Institute in the development of pump standards and best practice guides. Mr Bradshaw has a BEng (Hons) degree (Mechanical Engineering) from Heriot Watt University.
Thomas Liebner is a Hydraulics Engineer with ITT Goulds Pumps responsible for applied research and hydraulic design of engineered API process pumps. His responsibilities include – new product design, computational modeling, and hydraulic analysis for performance prediction. Dr Liebner has a B.S. in Mechanical and Aerospace Eng. from SUNY at Buffalo. He completed his studies for his doctorate in Mechanical Engineering at Penn State University.


