By Karl Danenbergsons, FIEAust, CPEng, RPEQ
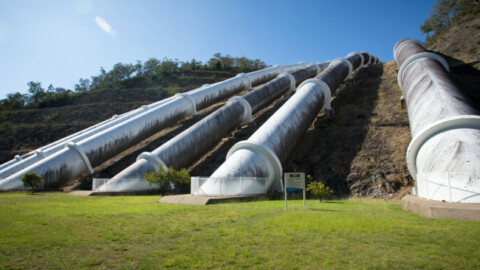
Every now and again, a pumped pipeline may appear to initially defy the normal conventions of a parabolic system curve. A recent example of this was when a new pump- set was required for a raw water transfer pipeline on a mine site in Western Australia. Read on to see if you would have recognised what was happening with this system.
The details that follow have been changed slightly from the actual site situation for simplicity. The pump-set was to be selected to cater for a variable flow rate operation up to a maximum of 130L/s. The 2km pipeline was constructed of DN316 PN16 PE100 polyethylene with the profile shown in Figure 1 noting that an air/vacuum valve was installed at the highest point in the pipeline at a true pipeline length of 1km.

Figure 1 – Pipeline profile
The system curve for the pipeline (i.e. a plot of the total static head plus the total friction head versus the flow rate) was calculated to be as per Figure 2. The shape of this curve does not appear to follow the usual smooth parabolic geometry where head loss due to pipe friction is a function of the square of the velocity.
In this case, the curve is parabolic, but appears to be two curves joined together – one for low to medium flow rates; and the other for medium to high flow rates. This may not come as a surprise to those who are experienced with pipeline design and operation. However, if you are relatively new to pipelines that are operating with one distinct (intermediate) highpoint over a wide flow rate range, this system curve may have you scratching your head for a few minutes. So what is actually happening here?
The hydraulic grade lines
A “hydraulic grade line” (i.e. a plot of the static head in the pipeline versus the pipeline profile) allows us to analyse what is happening more clearly. Plotting of the hydraulic grade line (HGL) also allows us to double-check the pump’s total dynamic head. If we use either the Australian Pipe Friction Handbook values for PE100 polyethylene, or if we calculate our own values using the Darcy-Weisbach Equation, we can determine the pipeline friction loss on a per kilometre of pipe basis.
The Australian Pipe Friction Handbook provides a pseudo-roughness value k of 0.0015mm with values readily available for DN315 PN16 PE100 polyethylene pipe. In our case, this pseudo-roughness value of 0.0015mm does not take into consideration the buildup in the bore of the pipe that occurs on this mine site after some months of operation and so instead, a higher value of 0.015mm for k has been chosen.


Figure 2 – Pipeline system curve
If we now use our k of 0.015mm in-conjunction with either (i) the Swamee-Jain Equation, or (ii) the Colebrook-White Equation to find the friction factor, we can then input that friction factor into the Darcy-Weisbach Equation to find the head loss on a per kilometre basis. This will be the slope of our HGL for the flow rates of interest.

Figure 3 – Plot of HGL’s for 70L/s and 100L/s versus pipeline profile
With reference to Figure 3, at 70L/s, the slope of the HGL is less than the slope of the pipeline section from the highpoint B through to the final discharge point C (and we know that there is a vacuum break at highpoint B). Therefore, the HGL must touch the pipeline at highpoint B and then slope back to the pump-set at pipeline zero length. The slope has been calculated to be (as per the step described above) 5.38m/km assuming k = 0.015mm. Note: We will have gravity flow from B to C.
Still with reference to Figure 3, you can see that when the flowrate is approximately 100L/s or higher, the slope of the HGL is actually greater than the slope between highpoint B and the final discharge C. We have calculated the slope of the HGL at 100L/s to be 10.43m/km assuming k = 0.015 mm. Figure 3 is useful as it shows us that when the pipeline is filling at lower flow rates, the pump-set only needs to cater for the static height change plus pipeline friction up to the highpoint at B.
However, when the flow rate is 100L/s approximately or higher, the pump set has to overcome the friction in the full length of the pipeline (i.e. 2km) and not just to the highpoint B (at 1km). Remember, for gravity flow to occur at our required flow rate, the head loss due to friction in a pipe section has to be lower than the height difference between the start and end of the section.

Figure 4 – System curves for Q < 100 L/s and Q >= 100 L/s
Figure 4 shows the system curves for Q < 100 L/s and Q >= 100 L/s on the same graph. We have also included the “imaginary” sections of the two system curves that cannot actually occur in practice due to the reasons described above. If we now delete the “imaginary” sections of the two system curves, we obtain the final system curve for the full flow rate range as per Figure 2 previously shown.
Conclusion
Be careful when you have an intermediate pipeline highpoint as you will have to determine the operating point of the pump when filling as well as for lower flow rates when the slope of the HGL is lower than the slope in the downhill section of pipeline.
A further complication is the installation of double-acting (or air/vacuum) valves at intermediate high points as these let air out during filling as well as during normal operation, and let air in to protect against vacuum conditions.
In summary, when you have a single intermediate high point in a pipeline with air/vacuum valves installed, you may have two system curves to consider.

Appendix A – Tabulated system curve calculations


